Today’s New York Times sports section provided this intriguing graphic on “putting a price tag on winning”. Their hometown Yankees stand out as the big spenders by far. It paid off in wins over the last decade – the period studied. However, if you cover up the point depicting the Yanks, the graph becomes far less compelling that salary buys wins – mainly due to counteractive results enjoyed by two low-payroll teams: The Minnesota Twins and the Oakland Athletics.
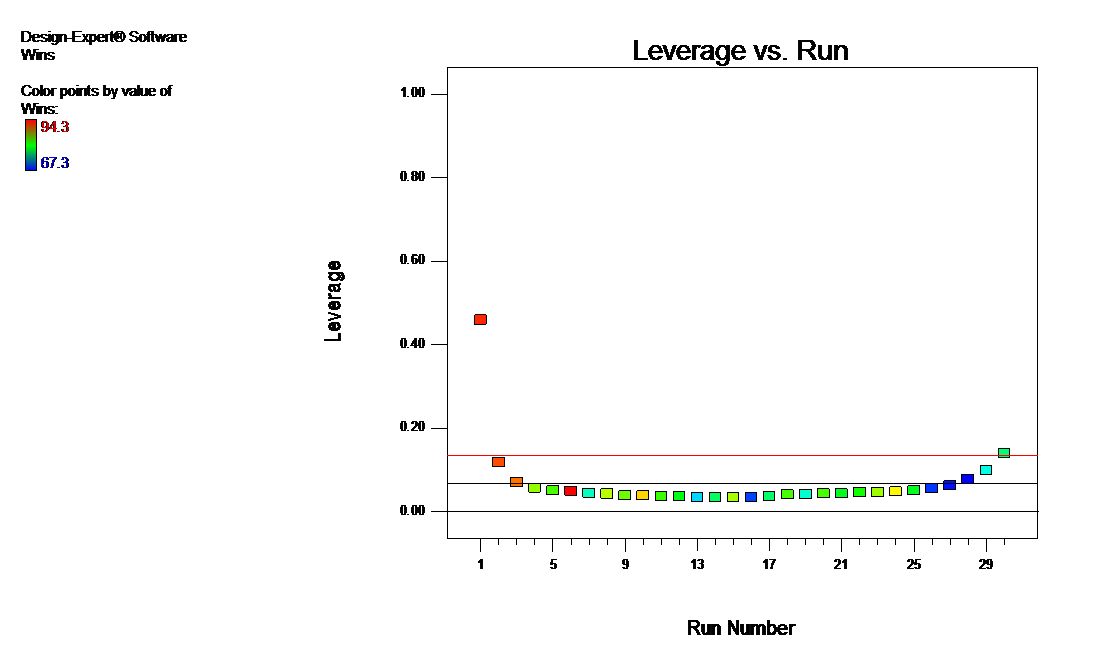
I found similar patterns and, more importantly, data to reproduce these, in this study of MLB Payroll Efficiency, 2006-2008 by Baseball Analyst Rich Lederer. No offense to Rich or the NY Times – it is the damn Yankees (sorry but I am weary of them defeating the Twins every post-season) who are the blame for this flaw in drawing conclusions from this data: One point exerts undue leverage on the fit, which you can see on this diagnostic graph generated by Design-Expert® software.
However, after doing the obvious thing – yanking the Yanks from the data, the conclusion remains the same: Higher payroll translates to more wins in Major League baseball. Here are the stats with/without the Yankees:
- R-squared: 0.41/0.34
- Wins per $ million of payroll (slope of linear fit): +0.13/0.16
In this case, a high leverage point does not exert the potential influence, that is, the end result does not change due to its location. If you’d like to simulate how leverage impacts fit, download this educational simulation posted by Hans Lohninger, Associate Professor of Chemometrics at Vienna University of Technology.