Archive for category sports
Boo Yahoo for breaking bad on my MAD
Posted by mark in sports, Uncategorized on November 20, 2013
“Once is happenstance. Twice is coincidence. Three times is enemy action!”
— Ian Fleming , Goldfinger
A simple, yet effective, measure of forecasting prowess is the mean absolute deviation (MAD). Yahoo’s computer projections for fantasy football do poorly on this measure. For example, one of my teams is thus far, through the first 11 weeks of this season, at 16 points MAD from an average projection of 70 per game. That’s an error exceeding 20%! But to make matters far worse, their forecast on this team is terribly biased. Given my indignation you can guess which way Yahoo has been erring (yes, I am a loser)—consistently over-estimating how points my players actually accumulate. Enough data has come in to make this statistically significant as indicated by the confidence interval on the margin of error (MOE) being below zero. Between my fantasy team and the Vikings it’s hard to say which is doing worse at underachieving. Thank goodness for the Minnesota Gopher gridioners exceeding all expectations. That is a ray of sunshine in a gloomy Fall for a football fanatic like me.
Quants and nerds bring science and reason to the dark fortress of superstition
Posted by mark in sports, Uncategorized on November 2, 2013
Alison Gopnik, The Wall Street Journal’s “Mind & Matter” columnist, goes a bit over the top today while paying homage to baseball’s statisticians. But one must be mindful that she teaches at U Cal Berkeley—less than 15 miles from the home field of the Oakland Athletics and “Moneyball” wizard Billy Beane. At the other end of the country the Boston Red Sox rule supreme in Major League Baseball in large part to calculations by their adviser Bill James—inventor of sabermetrics: the empirical analysis of baseball, especially statistics that measure in-game activity.
However, BoSox hero (one of many!) Jonny Gomes, who got a lot of disrespect for his measures—yet came through in the clutch, came back with this shot in an on-field interview with FOX Sports’ Ken Rosenthal after the clincher at Fenway Park:
“There’s a lot of sabermetrics, there’s a lot of numbers and stuff. The whole WAR stat. But when you go to playoffs, you want me to go to war with.”
WAR stands for Wins Above Replacement. The Red Sox led MLB on this statistic as shown here. Gomes only rated a bit over 1 on WAR. A “solid starter” should achieve a WAR of 2 or more according to this white paper by Boston’s Yawkey Report.
It’s hard to argue with success, but take that Jonny!
Statisticians break down March Madness brackets (and rule things in general)
Before the first round of NCAA basketball playoffs a number of pundits favored my Minnesota team to upset UCLA—one of the commentators before the broadcast last night went so far as to say they were a “lock”. Now I believe it. (They won.) However, I am doubtful they can beat Florida Sunday—gophers just do not stand a chance against gators. For a more reasoned breakdown on the odds for Sunday and beyond, see this bracket filled out superstar statistician Nate Silver for the New York Times.
People who can crunch data like Silver are in big demand these days according to Wall Street Journal Numbers Guy Carl Bialik in his column on March 2. The jobs site icrunchdata (very descriptive!) posted 28,305 openings for jobs in statistics and the like last month—up from 16,500 openings three years ago (I love data like this!).
It seems that number-herding nerds now rule, but there is a catch according to Dan Thorpe, senior director for analytics at Wal-Mart. He says that “the bulk of the people coming out [with statistics degrees] are technically competent but they’re missing the consultative and the soft skills, everything else they need to be successful.” So, which to do you prefer—good math skills (and lots of money) or an attractive personality (and many friends)? My advice is to aim for some of both.
Does a new ballpark lead to more wins for baseball teams?
Winter retains its grip up here in Minnesota at this time of the year, but the days are getting longer and the Twins are in camp down in Florida, so Spring fever is building. I can’t wait to get out to a game at Target Field with the sun shining and our nine flagging down fly balls and bashing them out of the park.
It will be interesting to see if the bloom comes off the rose of our new stadium now that our home team has stunk up the place for two years running. However, Minnesotans are so crazy to get outdoors after being stuck indoors for half the year that they may not care that their club has regressed to its mediocre mean.
According to this article in the latest Chance magazine new stadiums do not make teams statistically more competitive. Yes, teams do increase payroll in conjunction with the greater revenues coming from flocks of fans that come with their new digs. But this drops off in a year or two and things go back to the way they were.
I am not surprised. Nevertheless, I am positive that the Twins will come around this year and make it to the playoffs. That is the nature of a true baseball fan—hopeless optimism.
Obscurity does not equal profundity
Posted by mark in Basic stats & math, sports on February 12, 2012
“GOOD with numbers? Fascinated by data? The sound you hear is opportunity knocking.” This is how Steve Lohr of the New York Times leads off his article in today’s Sunday paper on The Age of Big Data. Certainly the abundance of data has created a big demand for people who can crunch numbers. However, I am not sure the end result will be nearly as profitable as employers may hope.
“Many bits of straw look like needles.”
– Trevor Hastie, Professor of Statistics, Stanford University, co-author of The Elements of Statistical Learning (2nd edition).
I take issue with extremely tortuous paths to complicated models based on happenstance data. This can be every bit as bad as oversimplifications such as relying on linear trend lines (re Why you should be very leery of forecasts). As I once heard DOE guru George Box say (in regard to overly complex Taguchi methodologies): Obscurity does not equal profundity.
For example, Lohr touts the replacement of earned run average (ERA) with the “Siera”—Skill-Interactive Earned Run Average. Get all the deadly details here from the inventors of this new pitching performance metric. In my opinion, baseball itself is already complicated enough (try explaining it to someone who only follows soccer) without going to such statistical extremes for assessing players.
The movie “Moneyball” being up for Academy Awards is stoking the fever for “big data.” I am afraid that in the end the call may be for “money back” after all is said and done.
Yankees leverage wins by throwing money at their players
Posted by mark in sports, Uncategorized on September 26, 2010
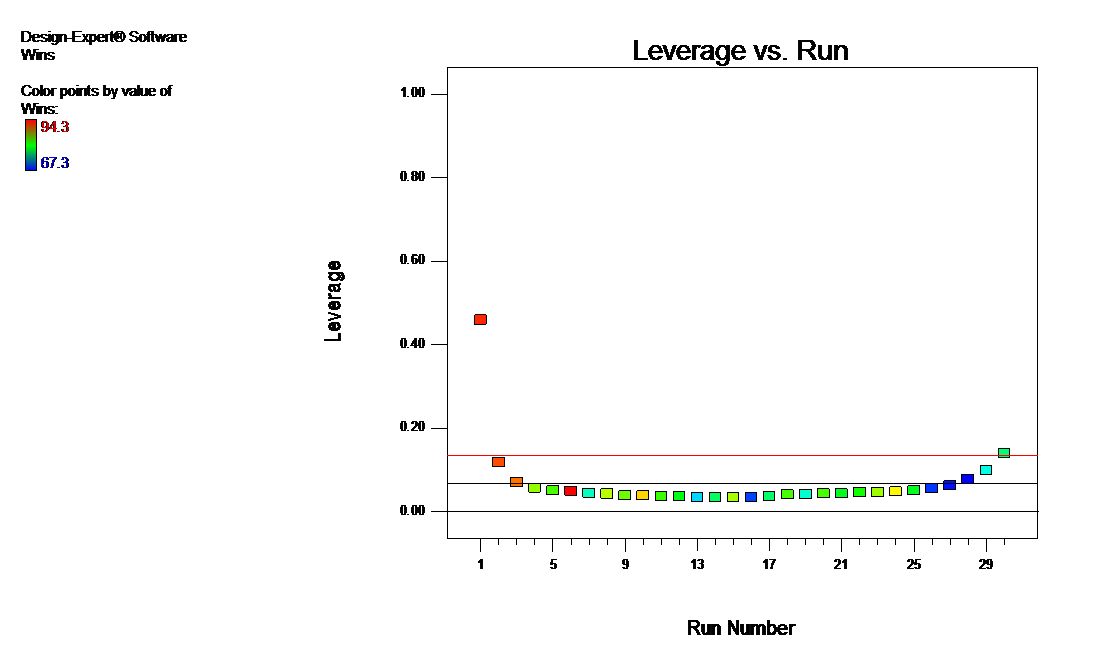
Today’s New York Times sports section provided this intriguing graphic on “putting a price tag on winning”. Their hometown Yankees stand out as the big spenders by far. It paid off in wins over the last decade – the period studied. However, if you cover up the point depicting the Yanks, the graph becomes far less compelling that salary buys wins – mainly due to counteractive results enjoyed by two low-payroll teams: The Minnesota Twins and the Oakland Athletics.
I found similar patterns and, more importantly, data to reproduce these, in this study of MLB Payroll Efficiency, 2006-2008 by Baseball Analyst Rich Lederer. No offense to Rich or the NY Times – it is the damn Yankees (sorry but I am weary of them defeating the Twins every post-season) who are the blame for this flaw in drawing conclusions from this data: One point exerts undue leverage on the fit, which you can see on this diagnostic graph generated by Design-Expert® software.
However, after doing the obvious thing – yanking the Yanks from the data, the conclusion remains the same: Higher payroll translates to more wins in Major League baseball. Here are the stats with/without the Yankees:
- R-squared: 0.41/0.34
- Wins per $ million of payroll (slope of linear fit): +0.13/0.16
In this case, a high leverage point does not exert the potential influence, that is, the end result does not change due to its location. If you’d like to simulate how leverage impacts fit, download this educational simulation posted by Hans Lohninger, Associate Professor of Chemometrics at Vienna University of Technology.
Stats reveal real ace of Twins pitching staff
 Twins fever is running rampant now in Minnesota. The home baseball club is leading their division and riding a wave of popularity with a new stadium and a home-town hero (Joe Mauer – a fellow graduate of my high school in Saint Paul). Over dinner this week with a colleague and a master statistician in town for a visit the talk turned to the Twins and who now should be considered their ace pitcher – Carl Pavano or Francisco Liriano. Although appreciative of Pavano’s consistently good performance over the entire year, I felt that Liriano has come on stronger in the second half of the season. Having reached a stalemate, the three of us agreed that the data might tell the story.
I found everything I needed to make my case for Liriano at ESPN’s statistics site for Major League Baseball. Here is the pitching “split” for the second half of the MLB season so far for Liriano vs Pavano; respectively:
- Win-Loss: 7-0 vs 6-4
- WHIP (walks and hits per inning pitched): 1.27 vs 1.32
- ERA (earned run average): 2.22 vs 3.41
Pavano is good, but Liriano is my pick as the current ace of the Minnesota Twins pitching staff. Why argue with words? Let the data speak.
A wonderful pairing: Baseball and statistics
 I managed to procure a seat to the opener yesterday for the new Minnesota Twins baseball stadium (Target Field) in Minneapolis. Although many questioned the wisdom of leaving it open to the elements, dire predictions of early games being snowed out did not materialize, at least this year. In fact, we enjoyed an unseasonable warm day while watching the hometown club defeat the Boston Red Sox to rousing cheers of the nearly 40,000 fans in attendance (39,715 to be precise). Many of the statistics for the landmark game are captured in this ESPN boxscore. Oh, oh, here I see an anomaly – the attendance reported at only 38,145 (96.6% full). My hunch is that the other 1,030 fans might be found at hometown hero Hrbek’s Bar – a spacious gathering spot in the stands of the Target Field.
Although the pre-game festivities and competition provided great entertainment, I eagerly awaited the breaks between half-innings to peruse the details in the Minnesota Twins 2010 Record and Information Book – a 396 page tome filled with 6 point type. Nearly every page features a statistic biased in favor of the team or a particular player. This is done by focusing on one specific attribute and then choosing the time frame which puts it in the most flattering light. For example, we learn on page 122 that “Anthony Swarzak became the first starting pitcher in club history to pitch 7.0 scoreless innings in his Major League debut.” I like the way they put the carry the statistic to the tenth’s decimal. : )
An ideal world: Ballpark beer cost correlated completely with quality of baseball

Indian's lefty Laffer delivers a pitch to Twin's slugger Cuddyer
When offered a free $149 seat behind home plate, I abandoned my desk last Wednesday for a matinee game between Minnesota and Cleveland. It was dollar-a-dog day so I enjoyed a $2 lunch washed down by what the Wall Street Journal (9/11/09) considers to be one of the Major League’s best-valued beer. They figure that the cost per ounce of brew – 27 cents at the Metrodome — should be based solely on the quality of the team.
The Twins have been consistent winners for some years and remain in the hunt for the Central Division of the American League after winning 2 out of 3 from the Detroit Tigers this weekend. Nevertheless, they chronically play second-fiddle to East Coast teams like the Boston Red Sox. WSJ reports that the crimson-hoser’s home field, Fenway Park, charges more than twice as much for beer for the Twins – far more than they merit by their winning percentage – a 46% overcharge, to be precise. Boston fares poorly on price-to-value across the board according to this in-depth analysis by a blogger writing as “JinAZ” for Beyond the Box Score – a Saber*-Slanted Baseball Community.
However, being a lifelong fan of baseball, and having been to many ballparks around the League, but never Fenway, I’d gladly pay a premium to see the Red Sox some day. (That explains why they can charge so much!)
*Referring to sabermetrics — a statistician specializing on baseball
Minnesota Twins beat the statistical odds once again
On May 17 I reported that sabermetrician Clay Davenport computed 200 to 1 against the Minnesota Twins making the Major League Baseball playoffs. Guess what? Not only did they achieve a place in post-season, they won their divisional championship. Granted, it was very unlikely the way the Twins turned their season around, and it was downright surrealistic for them to end up in first after their very last game. As I blogged earlier, statistics be damned by what we now know:
Twins win improbable division title.
One might do well by betting on the Twins when they are down again in future. For example,at the beginning of the 1991 baseball season, odds on 1990’s last-place Twins winning this year’s title were 100-1. They ended up as the World Series champs. Similarly, in 1987 the Twins went all the way in Major League Baseball. Prior to that season I went to Las Vegas for a conference and saw a betting board with odds at 100 to 1 against the Twins winning the championship. Ever since I’ve second-guessed myself for not betting anything — even $10 would have netted me $1000! Unfortunately, I am a man of little faith in the face of such overwhelming statistics.
PS. Post season results were not good — three games and out for the Twins in their playoff series with Oakland. 🙁 This is a triumph for sabermetrics because the Athletics are led by its biggest proponent —Billy Beane.