Archive for category Uncategorized
Yankees leverage wins by throwing money at their players
Posted by mark in sports, Uncategorized on September 26, 2010
Today’s New York Times sports section provided this intriguing graphic on “putting a price tag on winning”. Their hometown Yankees stand out as the big spenders by far. It paid off in wins over the last decade – the period studied. However, if you cover up the point depicting the Yanks, the graph becomes far less compelling that salary buys wins – mainly due to counteractive results enjoyed by two low-payroll teams: The Minnesota Twins and the Oakland Athletics.
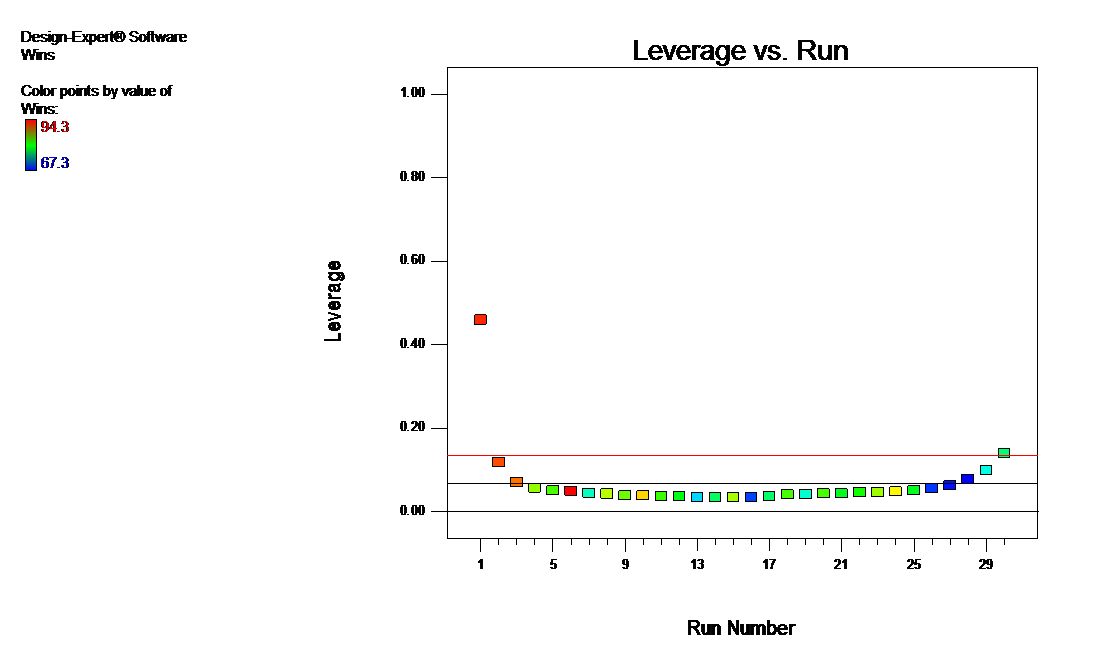
I found similar patterns and, more importantly, data to reproduce these, in this study of MLB Payroll Efficiency, 2006-2008 by Baseball Analyst Rich Lederer. No offense to Rich or the NY Times – it is the damn Yankees (sorry but I am weary of them defeating the Twins every post-season) who are the blame for this flaw in drawing conclusions from this data: One point exerts undue leverage on the fit, which you can see on this diagnostic graph generated by Design-Expert® software.
However, after doing the obvious thing – yanking the Yanks from the data, the conclusion remains the same: Higher payroll translates to more wins in Major League baseball. Here are the stats with/without the Yankees:
- R-squared: 0.41/0.34
- Wins per $ million of payroll (slope of linear fit): +0.13/0.16
In this case, a high leverage point does not exert the potential influence, that is, the end result does not change due to its location. If you’d like to simulate how leverage impacts fit, download this educational simulation posted by Hans Lohninger, Associate Professor of Chemometrics at Vienna University of Technology.
Minnesota’s ’08 Senate race dissed by British math master Charles Seife
Posted by mark in Basic stats & math, politics, Uncategorized on September 20, 2010
Sunday’s New York Times provided this review of Proofiness – The Dark Arts of Mathematical Deception – due for publication later this week. The cover, seen here in Amazon, depicts a stats wizard conjuring numbers out of thin air.
What caught my eye in the critique by Steven Strogatz – an applied mathematics professor at Cornell, was the deception caused by “disestimation” (as Proofiness author Seife terms it) of the results from Minnesota’s razor-thin 2008 Senate race, which Al Franken won by a razor-thin 0.0077 percent margin (225 votes out of 1.2 million counted) over Norm Coleman. Disestimation is the act of taking a number too literally, understating or ignoring the uncertainties that surround it; in other words, giving too much weight to a measurement, relative to its inherent error.
“A nice anecdote I like to talk about is a guide at the American Museum of Natural History, who’s pointing at the Tyrannosaurus rex. Someone asks, how old is it, and he says it’s 65 million and 38 years old. Sixty-five million and 38 years old, how do you know that? The guide says, well, when I started at this museum 38 years ago, a scientist told me it was 65 million years old. Therefore, now it’s 65 million and 38. That’s an act of disestimation. The 65 million was a very rough number, and he turned it into a precise number by thinking that the 38 has relevance when in fact the error involved in measuring the dinosaur was plus or minus 100,000 years. The 38 years is nothing.”
– Charles Seife (Source: This transcript of an interview by NPR.)
We Minnesotans would have saved a great deal of money if our election officials had simply tossed a coin to determine the outcome of the Franken-Coleman contest. Unfortunately, disestimation is embedded in our election laws, which are bound and determined to make every single vote count, even though many thousands in a State-wide race prove very difficult to decipher.
Quantifying statements of confidence: Is anything “iron clad”?
Posted by mark in Basic stats & math, Uncategorized on August 19, 2010
Today’s “daily” emailed by The Scientist features a heads-up on “John Snow’s Grand Experiment of 1855” that his pioneering epidemiology on cholera may not be as “iron clad” as originally thought. A commentator questions what “iron clad” means in statistical terms.
It seems to me that someone ought to develop a numerical confidence scale along these lines. For example:
- 100% Certain.
- 99.9% Iron clad.
- 99% Beyond a shadow of a doubt.
- 95% Unequivocal.
- 90% Definitive.
- 80% Clear and convincing evidence.
- 50% On the balance of probabilities.
There are many other words used to convey a level of confidence, such as: clear-cut, definitive, unambiguous, conclusive. How do these differ in degree?
Of course much depends on how is making such a statement, many of whom are not always right, but never in doubt. ; ) I’m skeptical of any assertion, thus I follow the advice of famed statistician W. Edwards Deming:
“In God we trust, all others bring data.”
Statistics can be very helpful for stating any conclusion because it allows one to never have to say you are certain. But are you sure enough to say it’s “iron clad” or what?
Blah, blah, blah…”quadratic”
Posted by mark in design of experiments, Uncategorized on August 15, 2010
This add by Target got my attention. It reminded me of my futile attempt to get my oldest daughter interested in math. For her the last straw was my overly-enthusiastic reaction to her questioning me why anyone would care about quadratic equations. Perhaps I over-reacted and lectured on a bit too long about this being a very useful approximating function for response surface methods, blah, blah, blah…
A breadth of fresh error
Posted by mark in politics, Uncategorized on June 20, 2010
This weekend’s Wall Street Journal features a review by Stats.org editor Trevor Butterworth of a new book titled Wrong: Why Experts Keep Failing US – And How to know When Not to Trust Them. The book undermines scientists, as well as financial wizards, doctors and all others who feel they are almost always right and thus never in doubt. In fact, it turns out that these experts may be nearly as often wrong as they are right in their assertions. Butterworth prescribes as a remedy the tools of uncertainty that applied statisticians employ to good effect.
Unfortunately the people funding consultants and researchers do not want to hear any equivocation in stated results. However, it’s vital that experts convey the possible variability in their findings if we are to gain a true picture of what may, indeed, transpire.
“Error is to be expected and not something to be scorned or obscured.”
— Trevor Butterworth
Tasty tidbits gleaned by a news-starved junky for stats trivia
Posted by mark in history, Uncategorized on June 10, 2010
The June 10th “Views” section of the International Herald Tribune (the global edition of New York Times) offered a few choice bits for me to savor after nearly two weeks traveling abroad without an American newspaper.
- A pie chart reporting on a June 1-7 telephone survey by Stanford University of 1000 American adults asking their opinion on belief in global warming. A pie chart illustrated that about 75% do believe in global warming, 20% do not, and 5% “don’t believe in pie charts”. I suspect that the author of this editorial, Jon A. Krosnick – a professor of communications at Stanford, meant this last bit of the chart to represent those who are undecided, but the graphic designers (Fogleson-Lubliner) figured they’d have some fun.
- Olivia Judson’s comments on “Galton’s legacy” note that this preeminent British statistician once published a comment in Nature (June 25, 1885 “Measure of Fidget”) that correlated boredom by how the audience squirmed during particularly wearisome presentations. I wish I would’ve thought of this “amusing way of passing an otherwise dull” lecture before attending two statistical conferences over the last several weeks. Based on this 2005 assessment of “Nodding and napping in medical lectures”, the more things change the more they stay the same, at least so far as presentations are concerned. The only difference is cost. For example, the authors figure that at a typical 1 hour talk to 100 high-powered professionals, say master statisticians, perhaps as much as $20,000 goes up in snores.
“Nodding was common, but whether in agreement with the speaker or in reverie remains undetermined.”
— Kenneth Rockwood (Dalhousie University), Christopher J. Patterson, McMaster University, David B. Hogan (University of Calgary)
Bonferroni of Bergamo
Posted by mark in Basic stats & math, history, Uncategorized on June 6, 2010

Bonferroni corrected

Uncorrected (random results)
I enjoyed a fine afternoon in the old Citta Alta of Bergamo in northern Italy – a city in the sky that the Venetians, at the height of their power as the “most serene republic,” walled off as their western-most outpost in the 17 century.
In statistical circles this town is most notable for being the birthplace of Carlo Emilio Bonferroni. You may have heard of the “Bonferroni Correction” – a method that addresses the problem of multiple comparisons.
For example, when I worked for General Mills the head of quality control in Minneapolis would mix up a barrel of flour and split it into 10 samples, carefully sealed in air-tight containers, for each of the mills to test in triplicate for moisture. At this time I had just learned how to do the t-test for comparing two means. Fortunately for the various QC supervisors, no one asked me to analyze the results, because I would have simply taken the highest moisture value and compared it to the lowest one. Given that there are 45 possible pair-wise comparisons (10*9/2), this biased selection (high versus low) is likely to produce a result that tests significant at the 0.05 level (1 out of 20).
This is a sadistical statistical scheme for a Machiavellian manager because of the intimidating false positives (Type I error). In the simulation pictured, using the random number generator in Design-Expert® software (based on a nominal value of 100), you can see how, with the significance threshold set at 0.05 for the least-significant-difference (LSD) bars (derived from t-testing), the supervisors of Mills 4 and 7 appear to be definitely discrepant. (Click on the graphic to expand the view.) Shame on them! Chances are that the next month’s inter-laboratory collaborative testing would cause others to be blamed for random variation.
In the second graph I used a 0.005 significance level – 1/10th as much per the Bonferroni Correction. That produces a more sensible picture — all the LSD bars overlap, so no one can be fingered for being out of line.
By the way, the overall F-test on this data set produces a p value of 0.63 – not significant.
Since Bonferroni’s death a half-century ago in 1960, much more sophisticated procedures have been developed to correct for multiple comparisons. Nevertheless, by any measure of comparative value, Bergamo can consider this native son as one of those who significantly stood above most others in terms of his contributions to the world.
PB&J please, but hold the jelly (and margarine) and put it on toast – a mixture design combined with a categorical factor
Posted by mark in design of experiments, Uncategorized, Wellness on May 27, 2010
, margarine (B) and jelly (C) on Toast")
 My colleague Pat Whitcomb just completed the first teach of Advanced Formulations: Combining Mixture & Process Variables. It inspired me to develop a virtual experiment for optimizing my perfect peanut butter and jelly (PB&J) sandwich. This was a staple for me and my six siblings when we were growing up. Unfortunately, so far as I was concerned, my mother generously slathered margarine on the bread (always white in those days – no whole grains) and then thick layers of peanut butter and jelly (always grape). As you see* in the response surfaces for overall liking [ 🙁 1-9 🙂 ], I prefer that none of the mixture ingredients (A: Peanut butter, B: Margarine, C: Jelly) be mixed, and I like the bread toasted. This analysis was produced using the Combined design tab from Design-Expert® software version 8 released by Stat-Ease earlier this year. I’d be happy to provide the data set, especially for anyone that may be hosting me for a PB&J dinner party. 😉
*Click to enlarge the plots so you can see the legend, etc.
Stat-Ease Corporation celebrates 25 years in business
Posted by mark in history, Uncategorized on May 16, 2010
My business partner Pat Whitcomb started up Stat-Ease as a business entity in 1982,* but he did not incorporate it until June of 1985. So that brings us to 25 years as a Corporation this coming month. This is quite an achievement for a software publisher – not many remain since 1985, I’ll wager, especially ones so specialized as us. That’s our saving grace, I figure – sticking to a niche like a clam in a wave-beaten hollow.
According to this report on U.S. Small Business Administration Office of Advocacy statistics from September 2009, only half of all startups survive five years. This correlates with a decay curve posted by Scott Shanem Professor of Entrepreneurial Studies at Case Western Reserve University, which shows that only about a quarter of companies remain alive after ten years.
I’d say we’ve done very well to make it this far. Having weathered the recent economic downturn in good shape, I feel positive about continuing on for at least a few years more. 😉
PS. If you’re interested to learn more about us, check out this history of Stat-Ease.
*The year the word “internet” was used for the first time according to this timeline. Check out these photos from the 1980’s by the Computer History Museum, especially the Osborne “portable” (24 pounds!) PC with a screen that looks about the size of today’s internet-enabled smart phones.
Two-level factorial experimentation might make music for my ears
Posted by mark in design of experiments, Uncategorized, Wellness on May 9, 2010
I am a fan of classical music – it soothes my mind and lifts my spirits. Maybe I’m deluded, but I swear there’s a Mozart effect* on my brain. However, a big monkey wrench comes flying in on my blissful state when my stereo speaker (always only one of the two) suddenly goes into a hissy fit. I’ve tried a number of things on a hit-or-miss basis and failed to find the culprit. At this point I think it’s most likely the receiver itself – a Yamaha RX496. However, before spending the money to replace it, I’d like to rule out a number of other factors:
- Speaker set: A vs B
- Speaker wire: Thin vs Thick.
- Source: CD vs FM-Radio
- Speaker: Left vs Right.
It’s very possible that an interaction of two or more factors may be causing the problem, so to cover all bases I need to do all 16 possible combinations (2^4). But, aside from the work this involves for all the switching around of parts and settings, I am stymied by the failure being so sporadic.
Anyways, I feel better now having vented this to my blog while listening to some soothing Sunday choir music by the Dale Warland Singers on the local classical radio station. I’m taking no chances: It’s playing on my backup Panasonic SA-EN25 bookshelf system.
*Vastly over-rated according to this report by the Skeptic’s Dictionary.