Archive for category Uncategorized
TV show misguided in mocking triangle graphs
Posted by mark in Uncategorized on October 28, 2007

One of my favorite TV shows, NBC’s Emmy-winning 30 Rock, stepped over a line last night with this sarcastic dialog:
Liz (comedienne Tina Fey) says to her boss Jack: You are a suit who feeds off creativity and hard work of other people and turns it into…pie charts and triangle graphs!
Jack (actor Alec Baldwin): What is a triangle graph?
Liz: I don’t know. It sounded real!
I remember being astounded at my first exposure to a triangle graph in a materials science class taught by University of Minnesota professor Chris Macosko . It was a ternary phase diagram showing the recipe for 18-8 stainless steel – commonly used for knives, spoons and forks – kitchen flatware. Virginia Tech’s Laboratory for Scientific Visual Analysis provides pretty pictures and explanation on how to read triangle graphs. They are a wonderful tool for pinpointing optimal formulations of foods, paints, chemicals, cosmetics, plastics and all sorts of products. For example, see this primer on mixture design that details a fun experiment I did with Pat on making a bouncier play putty .
However, I can appreciate how it must seem totally weird to the vast majority of people that a graph could be triangular. This episode of “30 Rock” had Jack getting after Liz to get on the fast track for attaining his elite financial level by making some investments. That got me thinking of how our company’s 401k advisor always promotes the changing mix of where to put your money, depending on how many years remain to retirement. I used our Design-Expert software to produce this triangle graph showing how the balance between stocks (A-X1), bonds (B-X2) and money market funds (C-X3)might change with age. It shows a flag set at age 30, which being near the top of the triangle is heavily weighted (77 percent) toward stocks. A second flag shows an investment portfolio for a 58-year old, mostly in money market funds.
Note how the triangle graph forces the mix to one-hundred percent. That is what makes them so neat for a chemical engineer like me – the kettle is always kept full, no more and no less. This financial example is just off the top of my head, but maybe a smart New York City business guy like Jack in “30 Rock” could make something out a triangle graph like this. Food for thought…
PS. I visited General Electric’s corporate R&D center in the mid ‘90s to help their Six Sigma Tiger Team leader for DOE get approval for installing Design-Expert. I was amazed to see big displays of NBC’s lineup of new. Ironically, one of them was “3rd Rock from the Sun,” which I realize now must have been a play off 30 Rockefeller Plaza – NBC’s headquarters.
The lottery of life versus death
Posted by mark in Uncategorized on October 22, 2007
I am enjoying a long weekend vacation in the Hill Country of Austin, Texas this weekend with my wife and youngest daughter. We took a side-trip east of the metro area to the town of La Grange where we came across a State historic site called Monument Hill. It commemorates the 1842 Mier Expedition that led to Sana Anna’s infamous decree that these invading Texans be decimated via lottery. The Mexican army put this command into effect via a lottery – 17 black beans were put into a pot with 159 white ones. Can you imagine having your life at forfeit for the ten percent chance of pulling a black bean? As one soldier after the other endured his lottery, did the remaining ones recalculate their odds? I went through something like this, but without the horror of anticipation, by surviving a heart attack and then learning that one in five do not. According to Texas Handbook Online, William A. A. (Bigfoot) Wallace did something much more useful than calculating his chances: He observed that the black beans were the larger and fingered the tokens successfully to draw a white bean.
Life really seems at times to be largely a matter of chance. Monument Hill overlooks the lovely Colorado River of Texas. The three of us followed a wooded trail along the bank that a park ranger recommended. Suddenly my two ladies leaped ahead of me. They had nearly stepped on a coral snake that I must have startled from my lead position. I mentioned this to the ranger upon my return and he just shrugged his shoulders and said we ought to expect snakes when walking the woods in Texas. However, although the ranger allowed that the coral is perhaps the most venomous snake in North America, its mouth is very small, so it cannot bite very effectively, and furthermore — this reptile is very shy. Nevertheless, we three naïve Minnesotans learned a lesson: Never mess with Texas – especially wearing sandals. Waiting in the Minneapolis airport, I was chuckling at the Austinites pacing around in their boots. Now I understand the reason for this choice of shoe.
PS. In my 8/10/06 blog titled “Stats that will be the death of you” I reported the odds of an American dying of snake bite: 1 in 2 million.
Treat or Trick? Drinkers punked by brewers?
Posted by mark in Uncategorized on October 14, 2007

Budweiser, the least expensive beer, did not fare as well in this blending experiment. Thus when I brought up my study at a gathering of industrial statisticians last week, the one from Anheuser-Busch (Bud’s brewer) expressed little enthusiasm. She suggested I try their Jack’s Pumpkin Spice Ale. I found this seasonal ale in the selection of beers at a bonfire last night and gave it a try. From the reviews I’ve read, it looks distinctive when poured into a glass, but straight out of the bottle it tasted no different than any other beer. Several other party-goers tried it, but none could discern anything special.
In their landmark article “Influence of Beer Brand Identification on Taste Perception (Journal of Marketing Research, Vol. 1, No. 3, Aug., 1964, pp. 36-39), Ralph I. Allison and Kenneth P. Uhl demonstrated that “beer drinkers cannot distinguish among major brands of unlabeled beer.” The experimental subjects rated their favorite brands significantly higher than other beers. But when they tasted and rated the same beers without labels (“nude”), the differences were not significant. As noted in my article on mixture design (link above), my taste test on beers a few decades later came up with the same result –perception dominated reality. Based on his comment about the recent merger of Miller and Coors, former Beer Writer of the Year Don Russell, better known as Joe Sixpack, evidently would agree with this premise that branding influences perceived taste:
“In beer-enthusiast circles, there’s a lot laughing going on, because, if I’m not mistaken, the name of the company is going to be MillerCoors. Beer enthusiasts refer to these types of beers as BudMillerCoors — just one word. They’re two thirds of the way there now. People who really love beer really do not distinguish them at all.”
So the challenge continues for beer lovers to remain skeptical about advertising claims by the big beer brewers. Put them to the test by asking a buddy to serve you nude, that is, without the label. Only then can you judge your taste preference objectively. Otherwise you don’t know Jack. (I must try ‘his’ Pumpkin Spice Ale again in a fairer test!)
Statistics so simple the only a child can do it
Posted by mark in Uncategorized on September 30, 2007
My youngest daughter, a senior in high school, asked me to help her with homework the other night: “Dad do you know anything about Z-scores?” 🙂
I am always happy to help with math or stats. However, it often proves challenging to not just get the correct answer, but also to follow the latest educational methodology.
My colleague Tryg passed along this ‘number-hummer’ by mathematician/satirist Tom Lehrer:
Hooray for new math,
New-hoo-hoo-math,
It won’t do you a bit of good to review math.
It’s so simple,
So very simple,
That only a child can do it!
If you can spare about 4 minutes, view this clever math/music video of Lehrer singing this song, including a verse on base 8 (“just like base 10…if you are missing two fingers”).
After many years of seeing my good deeds for helping with math homework not go unpunished, my oldest daughter admitted once that I had explained something “way better than the teacher or the book.” 🙂
As the British gamesman Nubar Gulbenkian said “The worse you play, the better you remember the occasional good shot.” This works well for me in golf and also math/stats – fields where I frequently fare poorly, but every so often, hit the sweet spot.
Fantasy football – addicting to a sports fan who loves stats
Posted by mark in Uncategorized on September 25, 2007

Assessing the risk versus benefit of wearing seat belts
Posted by mark in Uncategorized on September 13, 2007

While lamenting the recent bridge collapse in Minneapolis, my barber admitted to being so phobic about careening into rivers (we live along the banks of the Saint Croix) that he routinely unbuckles his seat belt so as not to be left hanging as his car slowly sinks below the water’s surface. The fear is that his body weight will keep the locking mechanism in place. My theory is that without the belt restraint any occupants of the car will be bashed about and lose consciousness, which could be prove fatal when going underwater. These differing views come down to my assessment of risk versus benefit relative to the odds figured by my barber.
This morning I heard a report on the local TV news that two teens, cousins, died in a two car collision where none of the occupants wore seat belts. The local sheriff told the reporter that in his opinion, no one would have been killed had they belted up. However, a relative of these unfortunates said that when they were children a family member had perished in a rollover in which the deciding factor was being trapped by a seat belt, thus they eschewed these restraining devices, thinking them unsafe. The irony of this assessment of risk versus benefits, proven wrong by this tragic event (or were they just unlucky?), is heart-rending.
Here is a statistic that tells me it’s best to buckle up: More than four-fifths of people in Minnesota wear seat belts, but about half of all people killed in car accidents went unrestrained. Think about it.
My awareness about preventing injury from car crashes is heightened at the moment due to me having just completed a defensive driving course. Minnesota law requires insurers to provide a 10 percent discount to anyone doing this at least once every three years. I’ve gone through the course twice now and found it helpful each time – getting good reminders of things I already knew and learning about a few changes in what the experts advise for certain situations. Odds are that anyone who drives regularly (I am averaging 20,000 miles per year), will be involved in an accident about every 10 years, according to MetLife Auto – my insurer who sponsored the course on defensive driving. Being a fan of statistics, I do have one beef with them – this quote puts me off:
“By learning to drive more defensively, you can reduce your chance of becoming the next statistic.”
I would think one would want to become a statistic because statistics are a good thing! However, I am certain that this attitude is held be a very small minority of the population, most of whom would much rather risk their lives than be subjected to statistics.
Anyways, be careful out there. Watch out for the other people. Put on your seat belt and drive defensively. That’s my assessment of risks versus benefits and I am sticking to it.
PS. This photo pictures the remains of what was once one of my favorite cars – a ’96 Ford Contour that I passed along to one of my daughters. She got hit by a Cadillac Escalade. Both drivers wore their belts and got protection from air bags, so although they were ambulanced to the local hospital, neither one suffered any apparent injury and walked out under their own power.
Jokes about scientists and statisticians who are powerfully driven to repeat bad things
Posted by mark in Uncategorized on September 7, 2007
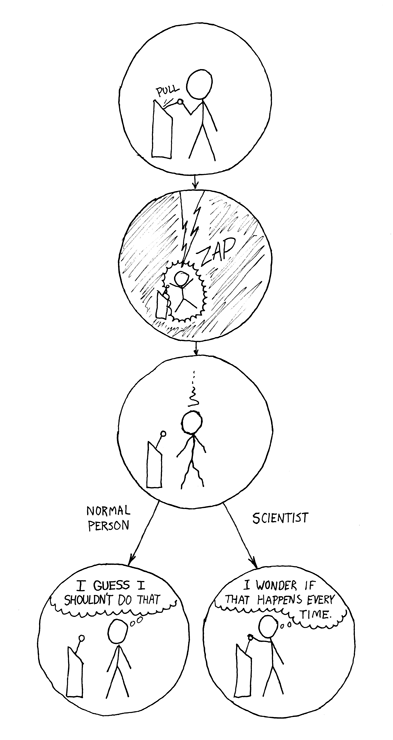
Physicist Randall Munroe posted this insightful cartoon showing how the behavior of a scientist differs from normal when confronted with shocking consequences of a controllable behavior. It reminded me of the anecdote about a research lab burning down accidentally. Afterward a physicist and chemical engineer (my profession) discuss the mass transfer of fuels, exothermic reactions and the like. Meanwhile a statistician stands there quietly listening. Finally the other two ask “What do you think?” The statisticians says that all of this technical talk matters little, action should be taken immediately. What is the recommendation? Burn down another lab! (Knowing how important sample size can be for the power of statistics, I suspect that this kept going until the entire complex went up in flames.)
Calculators achieve ‘retro’ status – ‘70’s style available again from HP
Posted by mark in Uncategorized on August 30, 2007

I saw in the news recently that Hewlett-Packard (HP) has re-issued the first hand-held scientific calculator introduced in 1972 for what was then the huge sum of $395 – half a month’s salary for an engineer just graduating around that time. The price for their new retro calculator is $60, which would only set back about two hours’ earnings of an engineer nowadays. The HP calculator that I first used at General Mills Chemical Inc. (GMCI) was shared by our entire group of process-development engineers. It was bolted to a table! I never took to HP’s highly-touted reverse polish notation (RPN), so unless a really precise calculation would be of value, I stuck with my slide rule or pencil and paper.
Our marketing director saw the photo of me at my GMCI desk and guessed that it dated back to 1971. She and her staff came up with a fun, retro theme for announcing our newest versions of Design-Ease® and Design-Expert® design-of-experiment (DOE) software – V7.1. I really felt old having to tell her that the picture was taken in the late ‘70’s. In 1971 I was a senior in high school and pocket calculators were yet to be invented. The personal calculator pictured, from Texas Instruments I believe, did not do logarithms, so I continued to carry a slide rule into the ‘80’s for accomplishing this function.
When R. A. Fisher invented DOE in the 1920’s at Rothamsted Experimental (Agricultural) Station in England, computations were done by ‘calculators’ – a room-full of mathematically adept people (mainly female). Rothamsted did not get a computer until 1954, just after this photo of Fisher was taken with his mechanical calculator.
“Fisher never concerned himself much with electronic computers – I remember him referring to them as ‘meccano arithmetic’…”
— F. Yates, The First Fisher Memorial Lecture on “Computers, The Second Revolution in Statistics,” March 23, 1966, British Museum, London (published in Biometrics, Vol. 22, No. 2 (Jun., 1966), pp. 233-251.)
The invention of response surface methods (RSM) by Fisher’s successor (and son-in-law) George Box made computers more of a necessity. Today no one would consider doing DOE without one.
So, it seems that calculators are going the way of slide rules and dinosaurs. I quit using mine many years ago – not counting the handy accessory provided by Microsoft. However, calculator hardware is still hanging on as evidenced the American version of the television show The Office (inspired by the same-named British show): See in this educational article a photo of Dwight’s calculator encased in gelatin by his colleague Jim. In a later episode Jim tries this again on a new colleague, Andy – who rivals Dwight for nerdiness, but the prank backfires by creating a huge blow-up in The Office. (If you are an office worker, you have to enjoy this over-the-top stuff!) Evidently calculators are still very important for some folks.
Making the most from unhappy events
Posted by mark in Uncategorized on August 21, 2007
 (Photo by my nephew Ross Nelson taken in the immediate aftermath of the I35 bridge collapse)
“All happy families are alike; each unhappy family is unhappy in its own way.” So begins Tolstoy’s classic novel Anna Karenina. According to Steven M. Shugan of the Warrington College of Business at University of Florida, it can be inferred from this statement that the most revealing factors for success might exhibit negligible variation among survivors in the struggle for dominance by enterprises at all levels, from businesses to entire civilizations. In honor to Tolstoy’s memorable introduction, he introduces the statistical term “TAK bias” in his editorial titled “The Anna Karenina Bias: Which Variables to Observe?” published in Vol. 26, No. 2, March-April 2007 of Marketing Science (underlines by me). (The author credits Pulitzer Prize winner Jared Diamond for introducing the Anna Karenina principle.) Shugan fears that many studies of what constitutes success are based on passive data collection that excludes nonsurvivors.
Ideally, researchers can take an active role in setting factor levels that produce a range of responses from failure to success. This is feasible for our clientele — mainly industrial experimenters working on process and product development or manufacturing improvement. For obvious reasons, it does no good to only produce perfect results. To put it plainly, one learns from his or her mistakes.
In our business of software development, one hopes that only good code will be written, but if it fails, ideally it will fail fast as pointed out in an article by Jim Shore published by IEEE SOFTWARE in September/October 2004 .
Unhappily, we need not be concerned about TAK bias in the case of a catastrophic failure such as the collapse of the I35 bridge entering downtown Minneapolis. Returning from Sunday’s exhilarating Minnesota Twins game, featuring a team-record 17 strikeouts by their ace pitcher Santana, my bubble of happiness burst when crossing the Mississippi on the Old Stone Bridge just up-river from the carnage. I have no doubt that the next bridge will be built for the ages, but I am less sanguine about other structures that still stand in spite of their decrepitude.
Coming ‘round the Smoky Mountains
Posted by mark in Uncategorized on August 10, 2007

For example, at the national park gift-shop I observed a touristy-looking rube pull a ‘possum off the stuffed-toy rack (mainly populated by Smoky Bears). He was taken aback when the gal at the register said “You know that this is one of them Himalayan ‘possums.” This ‘feller’ was terribly disappointed and said sadly “You mean it’s not from ‘here-abouts’?” She says, “Shore ‘enuf – we found him-a-lay’n along the side of the road.” That got a guffaw out of me and a glare from the other guy.
Another thing that I can’t get used to is the extreme topography of this Appalachian mountain region. Where I come from, things are flat as a ‘possum at the back end of a steamroller. I am amazed at the audaciousness of the angles. For example, the new Mystery Mine ride at Dollywood plunges 85 feet in a “hair-raising 95-degree vertical drop!” Beyond 90 degrees it just isn’t fair, so far as I am concerned.
I do enjoy listening to the country songs on the car radio – they tell some fascinating stories. For example, I heard a love song by Brad Paisley that features this unusual pickup line: “I’d sure like to check you for ticks.” Brad will be playing the Minnesota State Fair later this month — not for me.
Going from the ridiculous to the sublime, my wife and I toured the Biltmore Estate today – a five-dozen bedroom place! The builder, George Vanderbilt, inherited a small portion of his father’s $200 million fortune – nearly $100 billion in today’s currency. George’s share paid for a spread here in Asheville, North Carolina that covered nearly 20 miles from end-to-end, literally as far as the eye could see from the Biltmore’s balcony. Even a little bit of hundred billion goes a long way!