Favorite posts from three rings in the 2011 Management Improvement Blog Carnival (1 of 3)
Posted by mark in Consumer behavior on December 17, 2011
For the 2011 Annual Management Improvement Blog Carnival, hosted by John Hunter, we (my son Hank and I) will pick our favorite posts from these three blogs:
See us hosts and the blogs we’ve chosen to review at this site coordinated by John and background on the carnival itself here.
I will start off our part in this Carnival with my take on Edge Perspectives. The author is John Hagel — a fellow with a background in law and management who caught my fancy for his passion about embracing change. I live by Apostle Paul’s advice (1 Thes. 5:14-22) to “Test all things; hold fast what is good.” However, as Hagel explains in his blog on Cognitive Biases in Times of Uncertainty uncertainty breeds fear for new technologies that offer big benefits. It’s amazing to see how much people vary in interest/aversion to new technology. For example, I recently made an impulse purchase of Sony’s Internet TV Blu-ray disc player. When I asked Hank to help me set it up in our master bedroom, he got really keyed up about how this device streams content controlled by a nifty remote with all the functions of a full-size keyboard. But then my wife tried to turn the TV on – not a good scene. She just needs a lot more time to embrace technological change than Hank or me.
A number of the 2011 blogs in Edge Perspectives provide in-depth reviews of books by other big thinkers offering their prescription for how Americans can regain their edge. To be honest, I am just too busy dealing with everyday life to work up the necessary energy to get a grasp on these huge issues. My attention gets re-engaged when Hegel delivers thoughts from the heart such as his Revolution from the Edge entry. Here he reports back from TED, nonprofit devoted to “Ideas Worth Spreading” that draws top thinkers from around the globe, one of whom is invited to turn the world inside out – aided by a $100,000 award. Hagel focuses his thoughts on the uprisings in the Middle East and North Africa, where a well-educated younger generation broke free of old ways enforced by rigid and repressive dictators. Having just come away from India, where democracy fosters technological innovation (if only the infrastructure could catch up!), I am keen on Hagel’s call for those in developed nations to do everything possible for removing the barriers of corruption, debt and environmental degradation that stand in the way of further progress by emerging countries.
“As a man changes his own nature, so does the attitude of the world change towards him. … We need not wait to see what others do.”
Mahatma Gandhi
Formula for Happiness
 Spiritual teacher Jaya Row, a microbiologist by training, provides a simple formula for happiness in this article on Timeless Truths which I saw in The Times of India while vacationing in Aurangabad last month. Here it is: Happiness Quotient (HQ) equals the number of desires fulfilled divided by the number of desires entertained. She advises that we focus more on the denominator than the numerator of this HQ ratio. I interpret this as trying to be happy with less, rather than being greedy for more.
While in Aurangabad I came by the tomb of the Mughal emperor Aurangazeb. His father, Shah Jahan, built the Taj Mahal – the most beautiful building in the world, in my opinion.* Aurangazeb was an ascetic who followed a particularly austere from of Sufism. At the ripe old age of 88 the emperor was buried according to his wishes in a simple tomb purchased with money he earned himself by stitching caps. Sometimes the apple does fall far from tree. One wonders who led the happier life – Aurangazeb or his father. Now I think that the Taj Mahal really symbolizes the desires that never can be fulfilled in anyone’s life, that is, a monument to unhappiness.
Ending on a happier note, I offer up this photo of monkeys scampering along the road to Chand Minar, the Tower of the Moon, built by the Mughal conquerors of what came to be known as Aurangabad.
*Another story: While working for General Mills in the mid-1980s as a purchaser of Indian agricultural products, my agent bribed the guard at this monumental set of tombs in Agra to enable a private tour for my wife and I under a full moon and candlelight. Priceless!
Pareto distribution makes a handy ‘screw driver’
Posted by mark in Consumer behavior on October 30, 2011
“What scientific concept would improve everybody’s cognitive toolkit?” This was the 2011 question posed by sociologist Nicholas Christakis in his annual survey of science and technology gurus via the online salon Edge. Internet scholar Clay Shirky chose the Pareto distribution as a tool that could be put to better use for reducing income disparities. When I led manufacturing improvement teams, I graphed cumulative losses by cause and used this Pareto chart* to focus my engineering colleagues on the 20 percent that caused 80% of the problems. It seems that Christakis knew something when he put forward the Pareto early this year because, since then, the 99 Percent Project has taken aim at the 1 percent of folks from Wall Street who purportedly control all of our money. Being a technical type I am not interested in getting into issues of elitism. I’d rather experiment to identify the vital few factors that affect a system of interest.
Meanwhile, the United Nations declared this summer that tomorrow, October the 31st, the 7 billionth baby will be born. They may be overly precise on the timing, yet this is a very compelling statistic. Breaking down the world’s wealth by this population will continue to keep economists busy, but you can be sure it will maintain a “predictable imbalance” as observed by their colleague Pareto. Along those lines, I suggest you measure how Halloween candy gets distributed to your neighborhood population of trick-or-treaters. If a few big kids don’t take the lion’s share, I will eat my monster mask..
*The American Society of Quality (ASQ) provides a detailing of the Pareto Chart here.
Wrong more often than right but never in doubt
Posted by mark in Consumer behavior, Uncategorized on October 23, 2011
The New York Times Magazine provided a great readout on the “Surety of Fools”* in today’s issue. The author, psychologist Daniel Kahneman, starts by providing a real-life example of WYSIATI – “What you see is all there is.” Read his story to learn more about this, but basically it means that many times what you observe does not provide any meaningful information for predicting future behavior. Cocky Wall Street brokers are hit very hard, especially the males, who “act on their useless ideas significantly more often than women.” Ouch!
Kahneman examined the illusion of skill in a group of investment advisors who competed for annual performance bonuses. He found zero correlation on year-to-year rankings, thus the firm was simply rewarding luck. What I find most interesting is his observation that even when confronted with irrefutable evidence of misplaced confidence in one’s own ability to prognosticate, most people just carry on with the same level of self-assurance.
The bottom line is that you shouldn’t swallow everything said by assertive and confident people who advise on highly-variable systems such as financial markets. Heeding what an experienced physician suggests is one thing, but going with the most boastful money manager is another.
“True intuitive expertise is learned from prolonged experience with good feedback on mistakes.”
— Daniel Kahneman
“It’s what you learn after you know it all that counts.”
— John Wooden
* Posted earlier under a different title here.
Trouble with math & stats? Blame it on dyscalculia.
Posted by mark in Basic stats & math, Uncategorized on October 16, 2011
According to this article in Journal of Child Neurology “dyscalculia is a specific learning disability affecting the normal acquisition of arithmetic skills, which may stem from a brain-based disorder. Are people born with this inability to do math in particular, but otherwise mentally capable – for example in reading and writing? Up until now it’s been difficult to measure. For example, my wife, who has taught preschool for several decades, observes that some of her children progress much more slowly than other. However, she sees no differential in math versus reading – these attributes seem to be completely correlated. The true picture may finally emerge now that Michèle M. M. Mazzocco et al published this paper on how Preschoolers’ Precision of the Approximate Number System Predicts Later School Mathematics Performance.
Certainly many great minds, particularly authors, abhor math and stats, even though they many not suffer from dyscalculia (only numerophobia). The renowned essayist Hillaire Belloc said*
Statistics are the triumph of the quantitative method, and the quantitative method is the victory of sterility and death.
I wonder how he liked balancing his checkbook.
Meanwhile, public figures such as television newscasters and politicians, who appear to be intelligent otherwise (debatable!) say the silliest things when it comes to math and stats. For example a U.S. governor, speaking on his state’s pension fund said that “when they were set up, life expectancy was only 58, so hardly anyone lived long enough to get any money.”** One finds this figure of 58, the life expectancy of men in 1930 when Social Security began, cited often by pundits discussing the problems of retirement funds. Of course this was the life expectancy at birth, in times when infant mortality remained a much higher levels than today. According to this fact sheet by the Social Security Administration (SSA), 6.7 million Americans were aged 65 or older in 1930. This number exhibits an alarming increase. The SSA also provides interesting statistics on Average Remaining Life Expectancy for Those Surviving to Age 65, which show surprisingly slow gains over the decades. I leave it to those of you who are not numerophobic (nor a sufferer of dyscalculia) to reconcile these seemingly contradictory statistical tables.
*From “On Statistics”, The Silence of the Sea, Glendalough Press, 2008 (originally published 1941).
**From “Real world Economics / Errors in economics coverage spread misunderstandings” by Edward Lotterman.
Clickers allow students to vote on which answer is right for math questions
Posted by mark in Basic stats & math on October 12, 2011
Yesterday I attended a fun webinar on Interactive Statistics Education by Dale Berger of Claremont Graduate University. Because I was multitasking (aka “continuous partial attention” — ha ha) at work while attending this webinar my report provides just the highlights. However, you can figure out for yourself what they (the stats dept at Claremont) have to offer by going to this web page offering WISE (Web Interface for Statistics Education) tutorials and applets.*
After the presentation a number of educators brainstormed on interactive stats. David Lane of Rice U (author of many stat applets) suggested the use of “interactive clickers” – see this short (< 2 min.) newscast, for example. I wonder what happen when a majority vote for the wrong answer? For some teachers it might be easiest just to declare the most popular response as the correct answer. That would be consistent with the way things seem to be going in politics nowadays. ; )
*Just for fun try the Investigating the Central Limit Theorem (CLT) applet (click the link from the page referenced above or simply click here). This would be a good applet to provide when illustrating CLT using dice (such as is done in this in-class exercise developed by two professors from De Anza College). In this case, pick the uniform Population and sample size 2. Then Draw a Sample repeatedly, and, finally, just Draw 100 samples. Repeat this exercise with sample size 5 a la the game of Yahtzee (a favorite in my youth). Notice how as n goes up the distribution of averages becomes more normal and narrower. That’s the power of averaging.
Speed of light exceeded (astounding!)? Or was it measurement error?
 This morning I read this NY Times news that European physicists measured neutrinos at 0.0025 percent above the speed of light. If so, it may be only a matter of time before you can send yourself a telegram to not do whatever you did that you’ve always regretted and, by the way, to please invest a thousand dollars in Microsoft, Facebook or the like (depending on the timing).
Years ago I visited Mount Wilson Observatory in California with my son Hank. See me pictured by their two domes that house 60 and 100 inch telescopes; respectively. This was the center for landmark experiments on the speed of light as detailed in this Wikipedia article. Obviously measurement error made this a very difficult.
Being a skeptic, and seeing that a similar experiment* found neutrinos whizzing about at the speed of light, but not beyond that, I was going to advise caution. However, Hank gave me the heads up to today’s xkcd cartoon (click the image to make it bigger and more readable). I think this guy has got a better idea.

*Done with a group at the Soudan Underground Laboratory here in Minnesota. They first did physics experiments there, in an abandoned iron mine, in 1980. I featured this in a retro young-adult techno/adventure/mystery/thriller called The Secret of the Wolf Ring (Amazon, Kindle Edition).
Blended learning for math & stats
Posted by mark in Basic stats & math on September 18, 2011
Check out this intriguing YouTube video by Khan Academy proving the Pythagorean Theorem:
Now imagine grade schoolers being lectured like this at home and then spending their time in class following up one-on-one or in small group sessions with the teacher. See this report from a 7th grade math teacher in California who takes advantage of this “blended learning” approach. As face-to-face time with educators becomes ever-more expensive, expect more-and-more use of asynchronous web-based training like this. That’s what I foresee. Don’t you?
Proofing Blackbeard’s rum
Posted by mark in pop, Uncategorized on September 11, 2011
Being only about a week from this year’s Talk Like a Pirate Day this Atlantic Monthly article (read belatedly from a backlog of magazines) about Gunpowder on the Rocks caught my eye. I like the idea of setting a drink on fire and then drinking it, as Blackbeard did to impress his pirate crew.
It turns out that this is a practical test of rum to ensure it hasn’t been watered down by a ne’er-do-well hornswoggler, as you can see in this video by experimental archaeologist Jeff Lindow. After watching this, I decided not to try this at home as it would no doubt shiver my timbers. However, if it gets cold enough this winter, I might consider a swig of this gunpowder-infused Man O’War rum. Yo ho ho!
It may pay to make your product less than perfect!
Posted by mark in Consumer behavior, Uncategorized on September 4, 2011

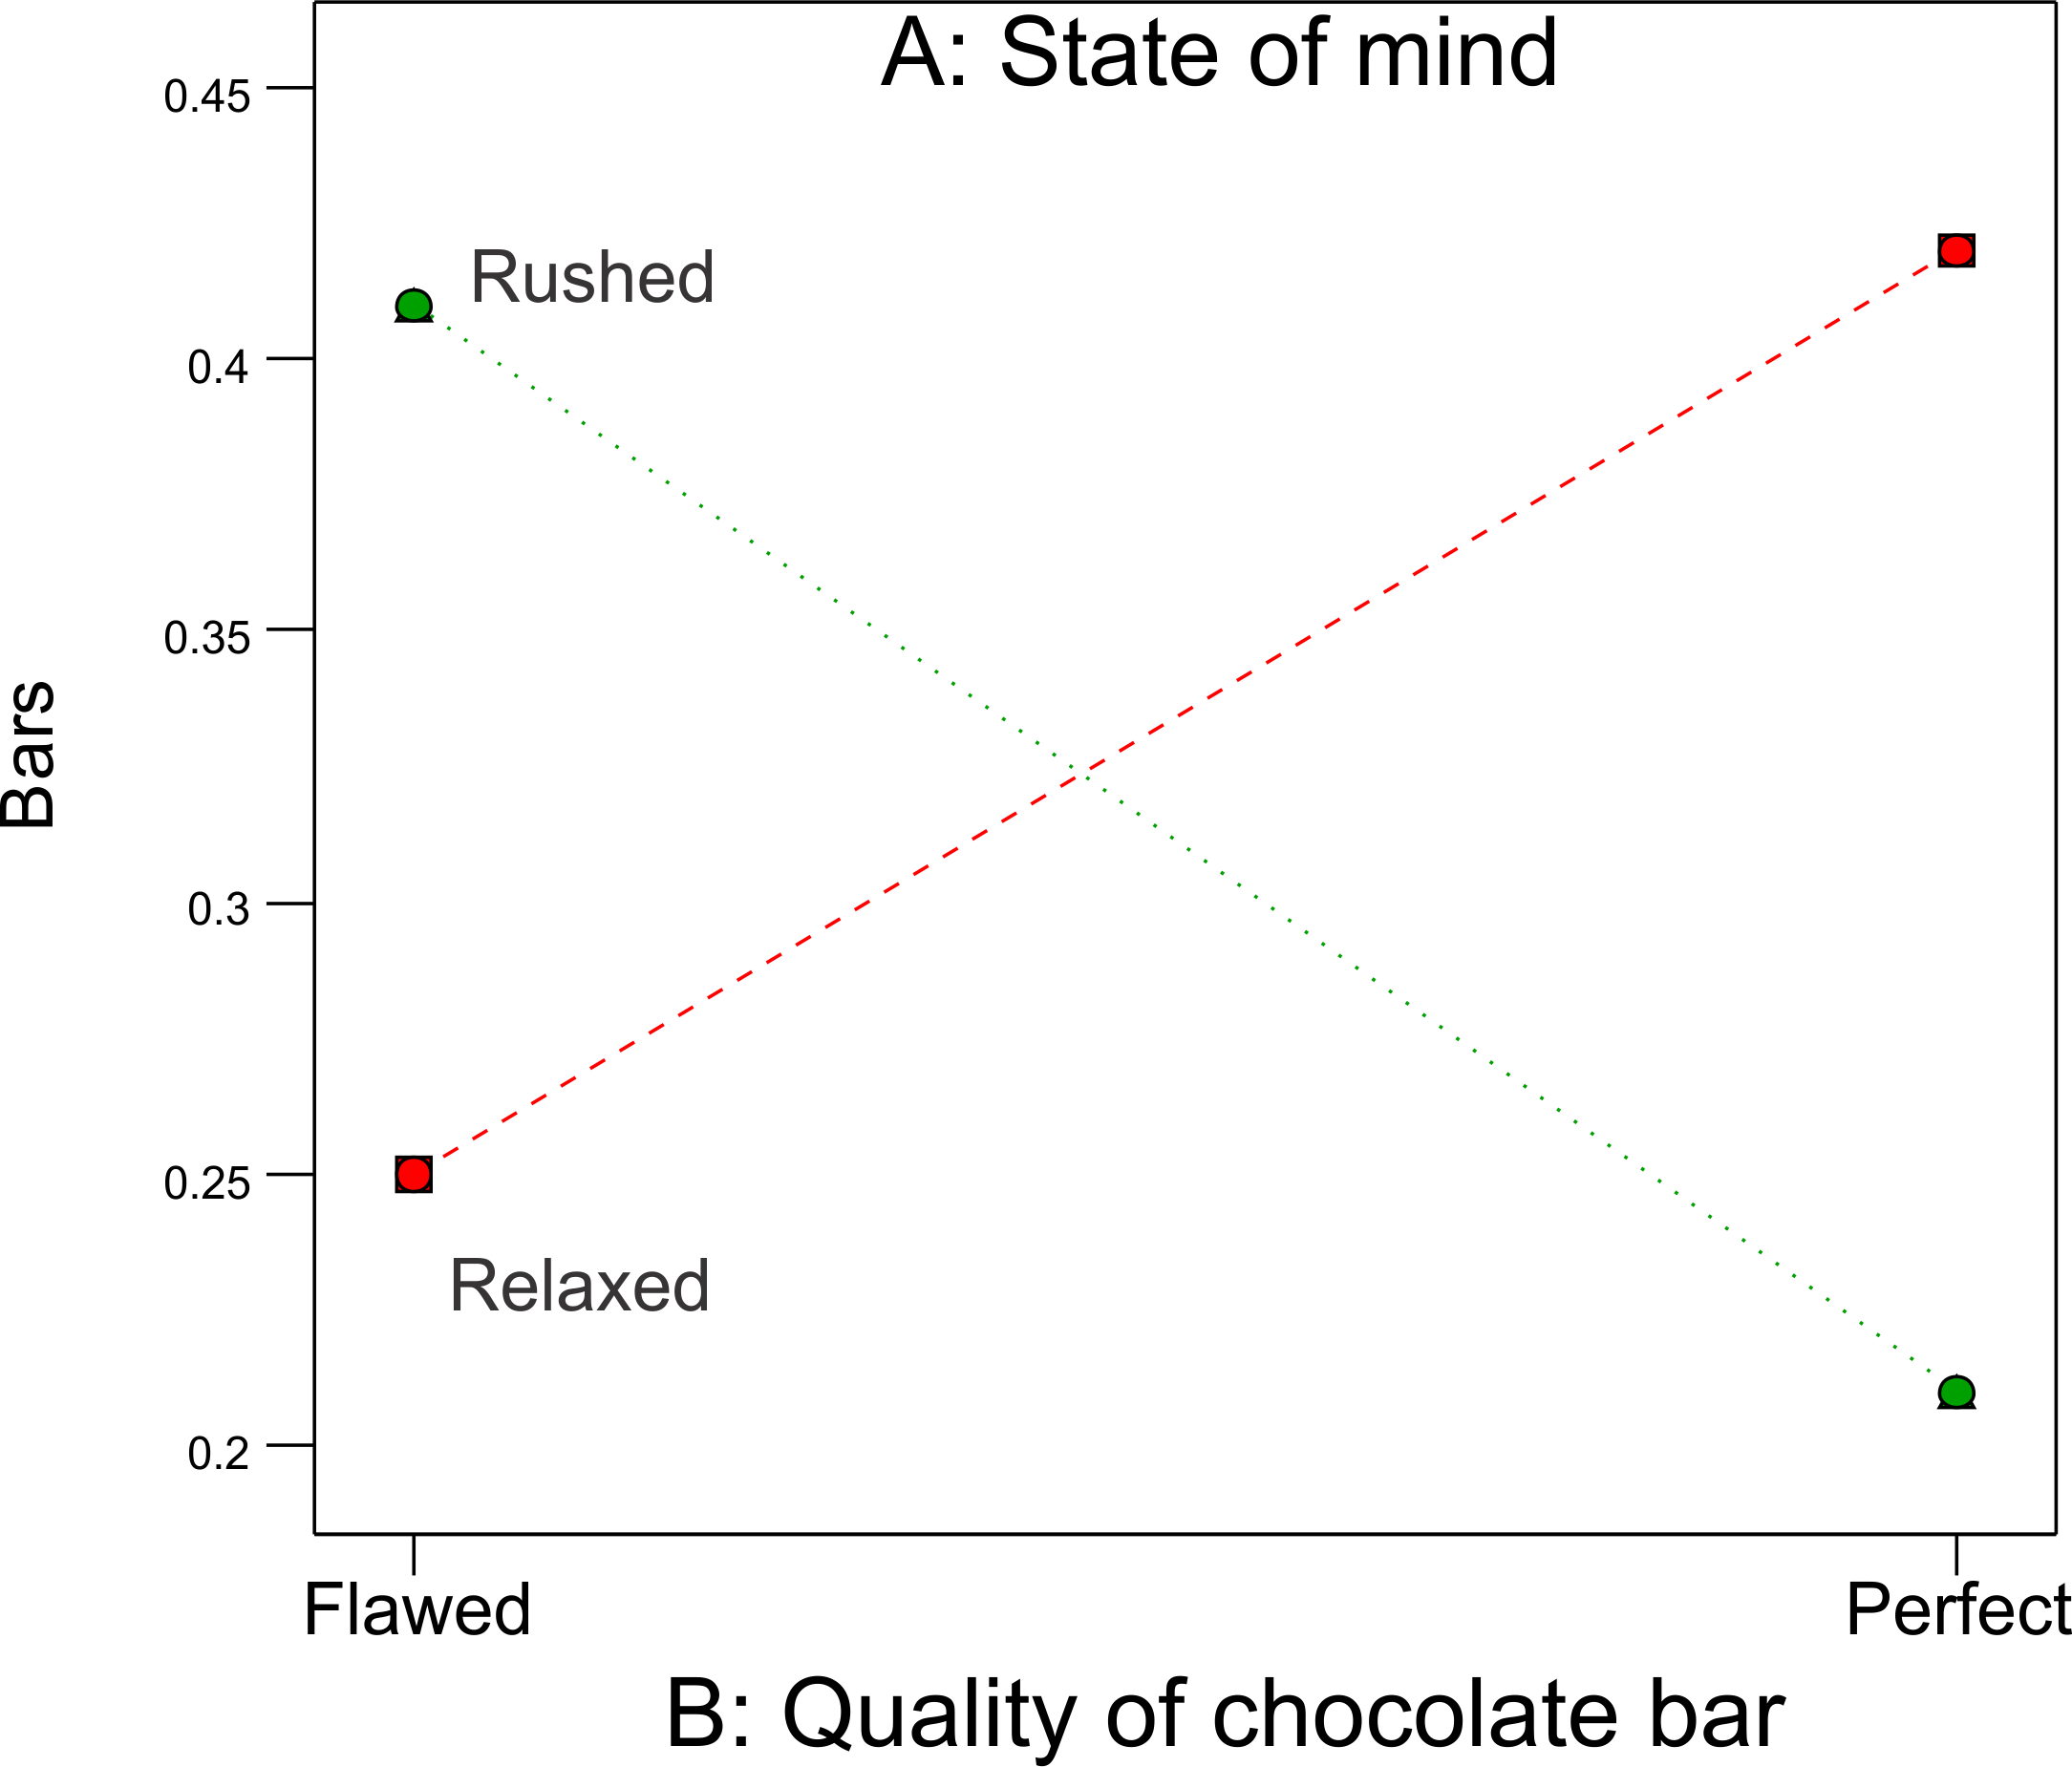
I once analyzed data from a designed experiment that quantified consumer distaste for flaws in chocolate-covered cherries. This was a very rewarding project – lots of free candy! It also produced a counter-intuitive result: People preferred boxes with a few upside-down morsels. I figure this is akin to a beauty mark adding to the enticement of a model or actor. This article on “When Blemishing Leads to Blossoming”, published online by the Journal of Consumer Research confirms that under specific circumstances, a flaw makes a product more attractive. For example, in one experiment (highlighted in the July 16 issue of Wall Street Journal) the researchers (Danit Ein-Gar, Baba Shiv, Zakary L. Tormala) offered either perfect or slightly flawed chocolate bars to several hundred relaxed (strolling around) or stressed (rushing to exams) college students. I searched out the results and reproduced them in this interaction graph from Design-Expert® software. It seems to me that this surprising effect, presuming it’s real, provides yet another devious opportunity for marketing mavens to make us buy stuff. One thing I might advise is that you never buy anything when you are in a hurry.